
Interactive Tax Maps
In 2026, the Town of Northport conducted a town-wide revaluation of all properties for the first time since 2003. BaysideMaine.com has used the data from that reassessment to create interactive tax maps below. The town’s website has more information on the revaluation here. The town’s Property Information page is available here.
These maps show select information for each tax parcel, including the 2025 assessment and town tax, the new (2026) assessment and town and village taxes, and the percentage changes in the assessment and taxes. For each map that includes Northport Village Corporation parcels, you can toggle between all Northport properties and just NVC properties. A “Heat Map” button allows you to visualize changes in taxes through the color-coding of tax parcels depending on a parcel’s percentage change in tax from 2025 to 2026. This presentation can be toggled on or off with the button. If you’re looking at just NVC properties, the heat map is based on the percentage change in NVC taxes; otherwise, it’s based on the percentage change in Northport taxes.
While these maps are optimized for viewing on a personal computer, where you can see each property’s tax information as you move your cursor over it, they work well on mobile devices, too.
The 2026 revaluation resulted in an approximate 170% increase in the total assessed value for the town and a 161% increase for the village. The town’s 2026 budget called for about an approximate 5.4% increase in property tax levies. The consequence of this is that, if an individual property’s assessment increased 170% (the same as for the town overall), its 2026 taxes would also increase about 5.4%. If the reassessment resulted in less than a 170% increase, the property’s 2026 taxes would increase less than 5.4%, and an assessment increase of more than 170% would result in a 2026 tax increase for that property of greater than 5.4%. The Village’s 2026 tax increase was about 0.5%, so a property with the village-wide average assessment increase of 161% would see about a 0.5% increase in NVC taxes.
DISCLAIMER: While these interactive maps utilize publicly available data from the Town of Northport (as of 8/6/26), they are in no sense a product of the town. They have been created by a private resident. While the mapping and information contained herein is believed to be accurate, anyone using the data for anything other than an interesting overview should independently verify any data on which they rely. Please provide any feedback to dan@baysidemaine.com.
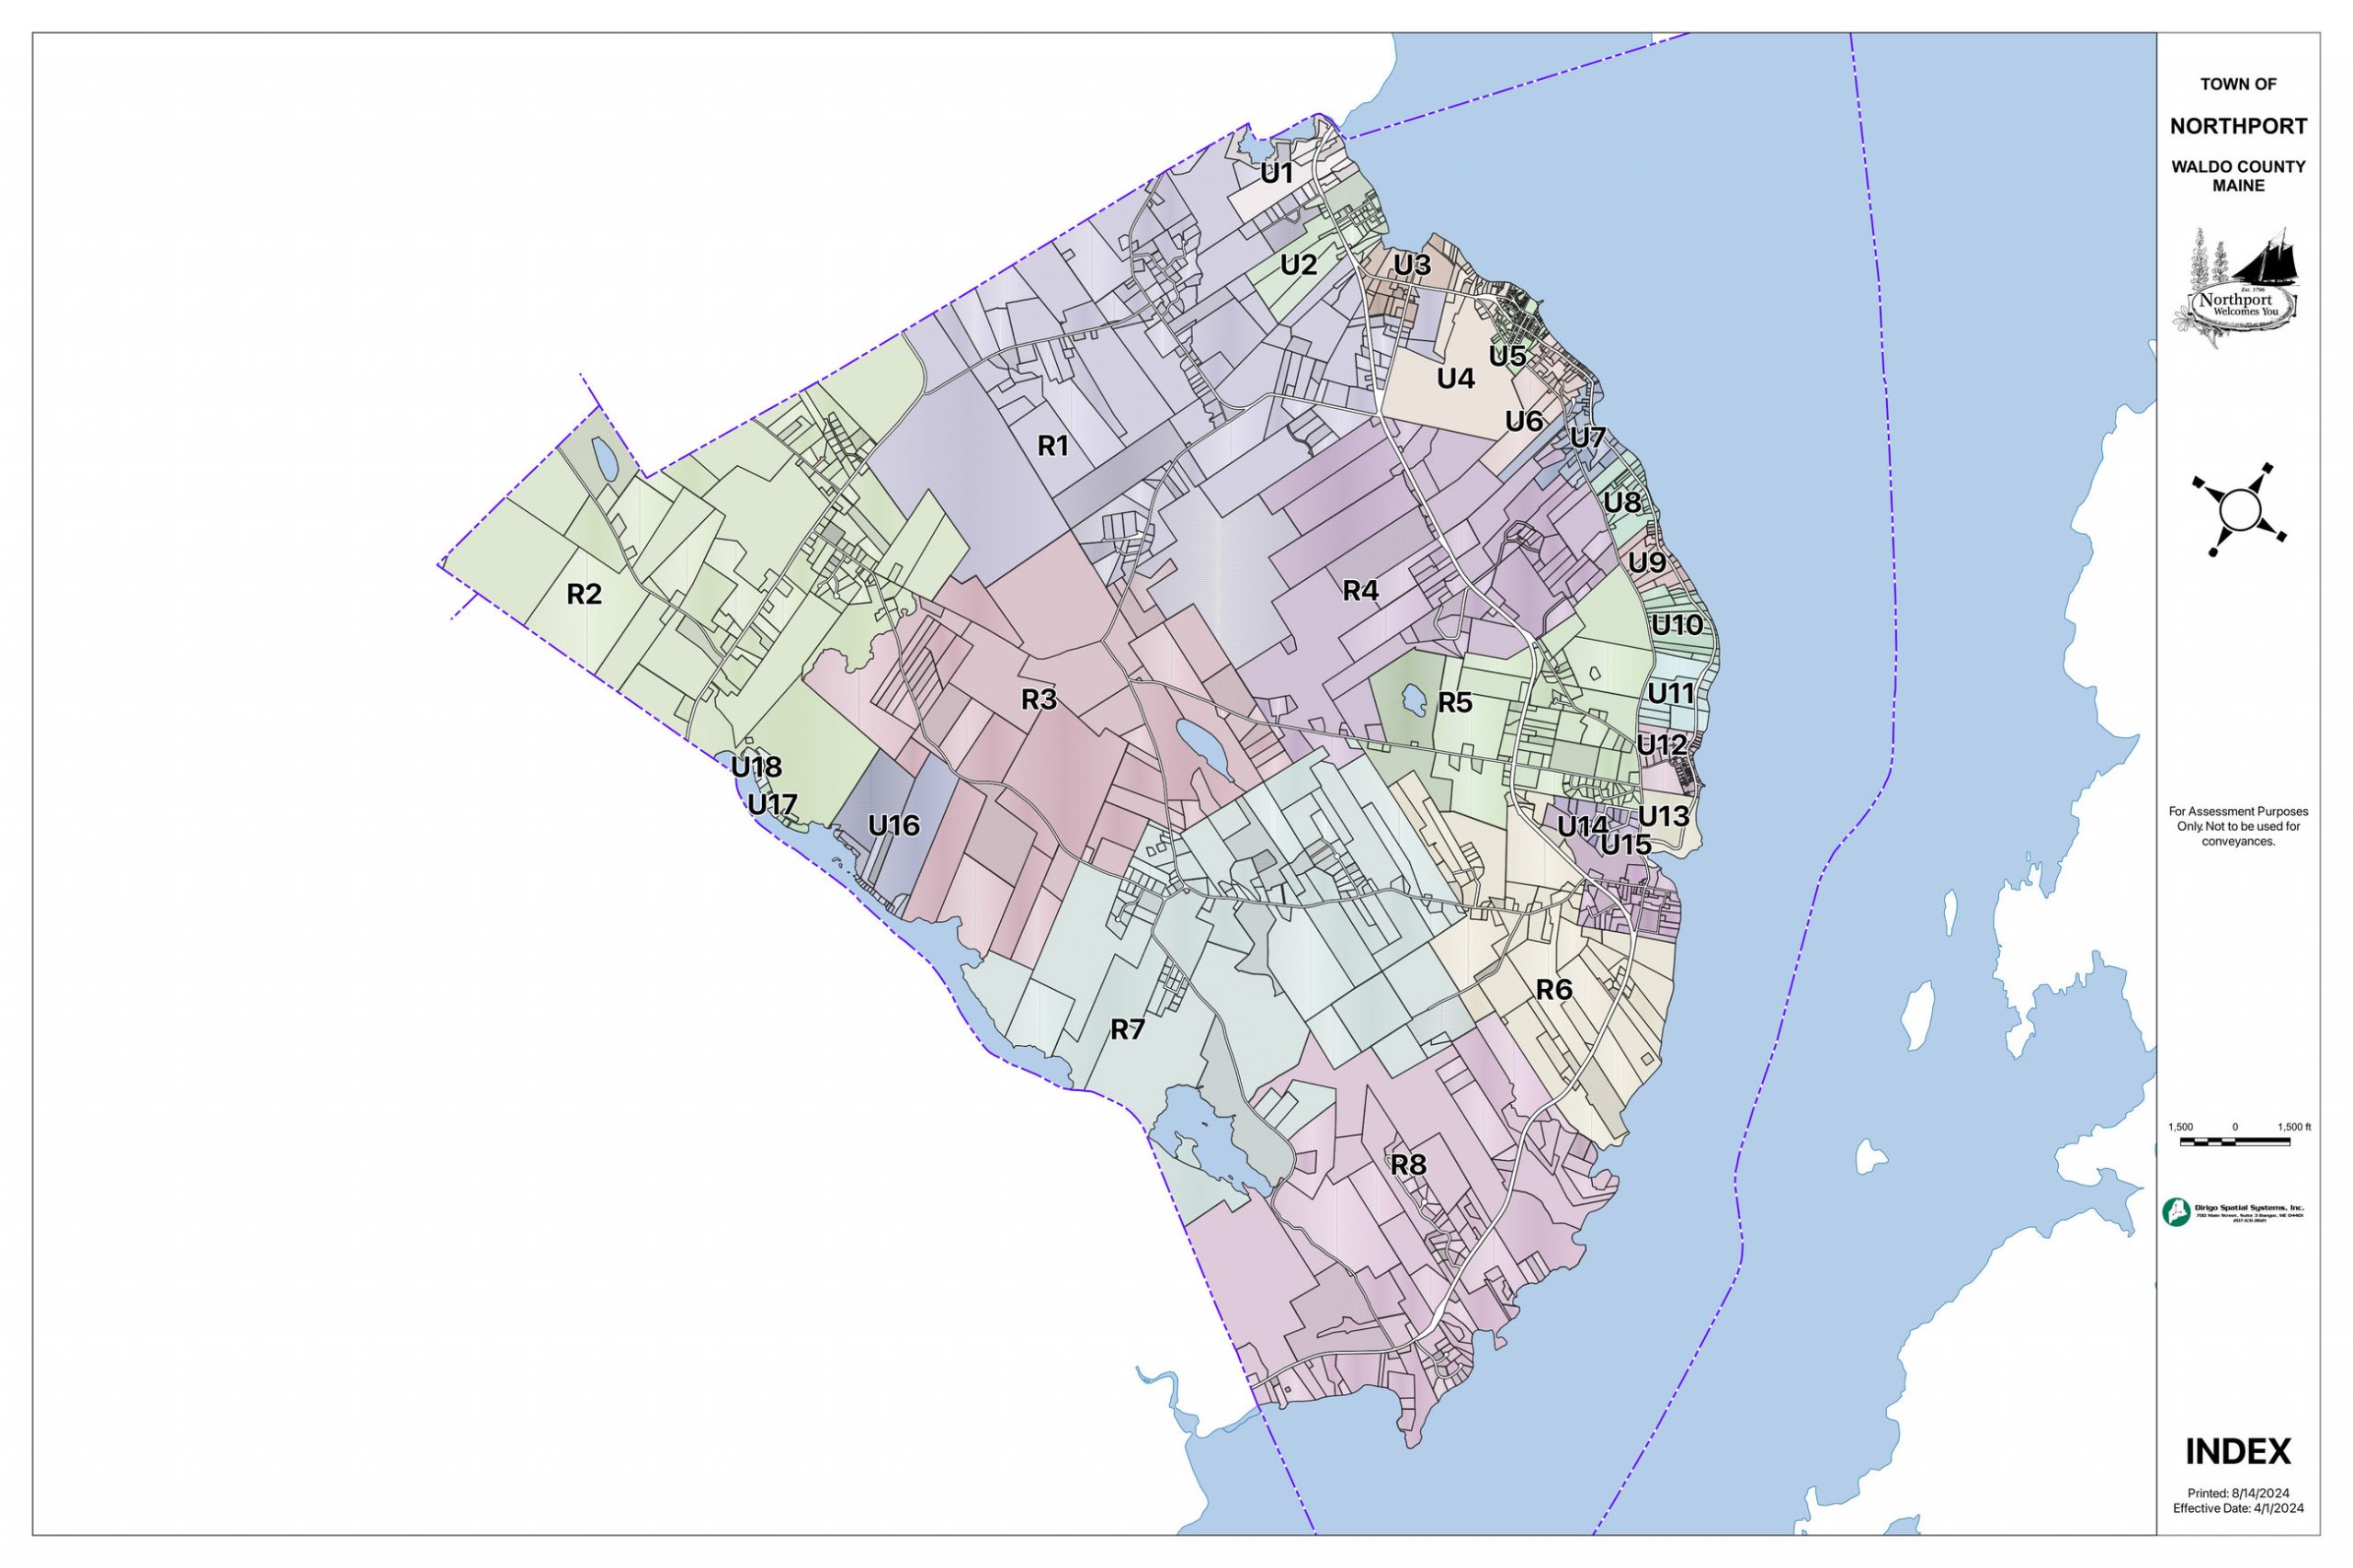
All tax maps
Full Town Interactive Map All 1,654 properties in one seamless map · search, pan and zoomTap a map number on the index, or pick one from the list. Each map opens in this window with a Return to Index button.